11 min read


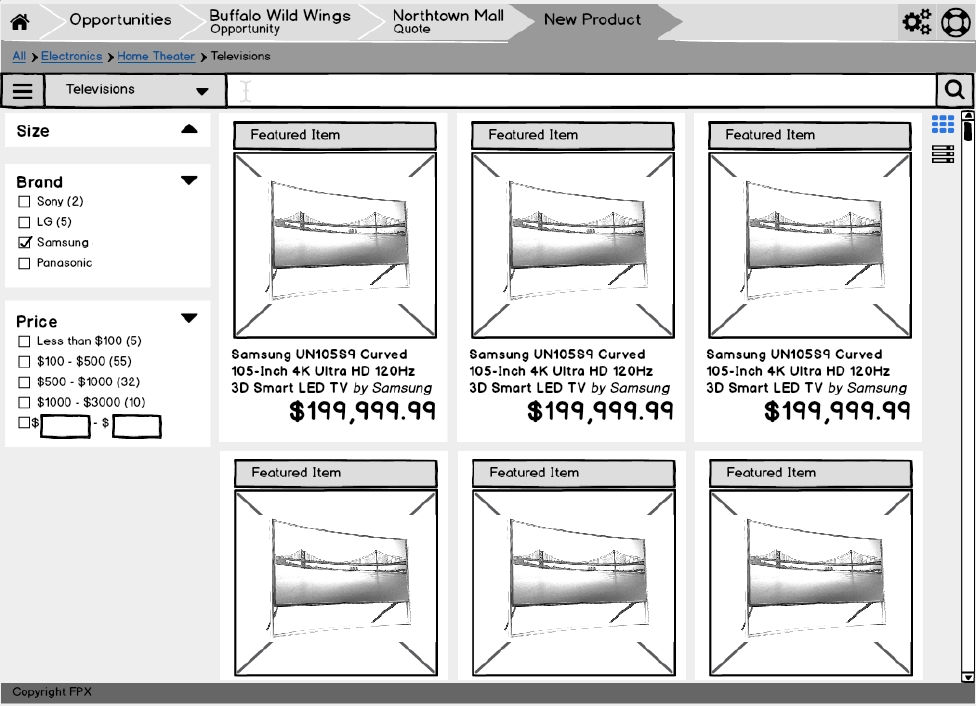
CPQ Interactive: A Case Study

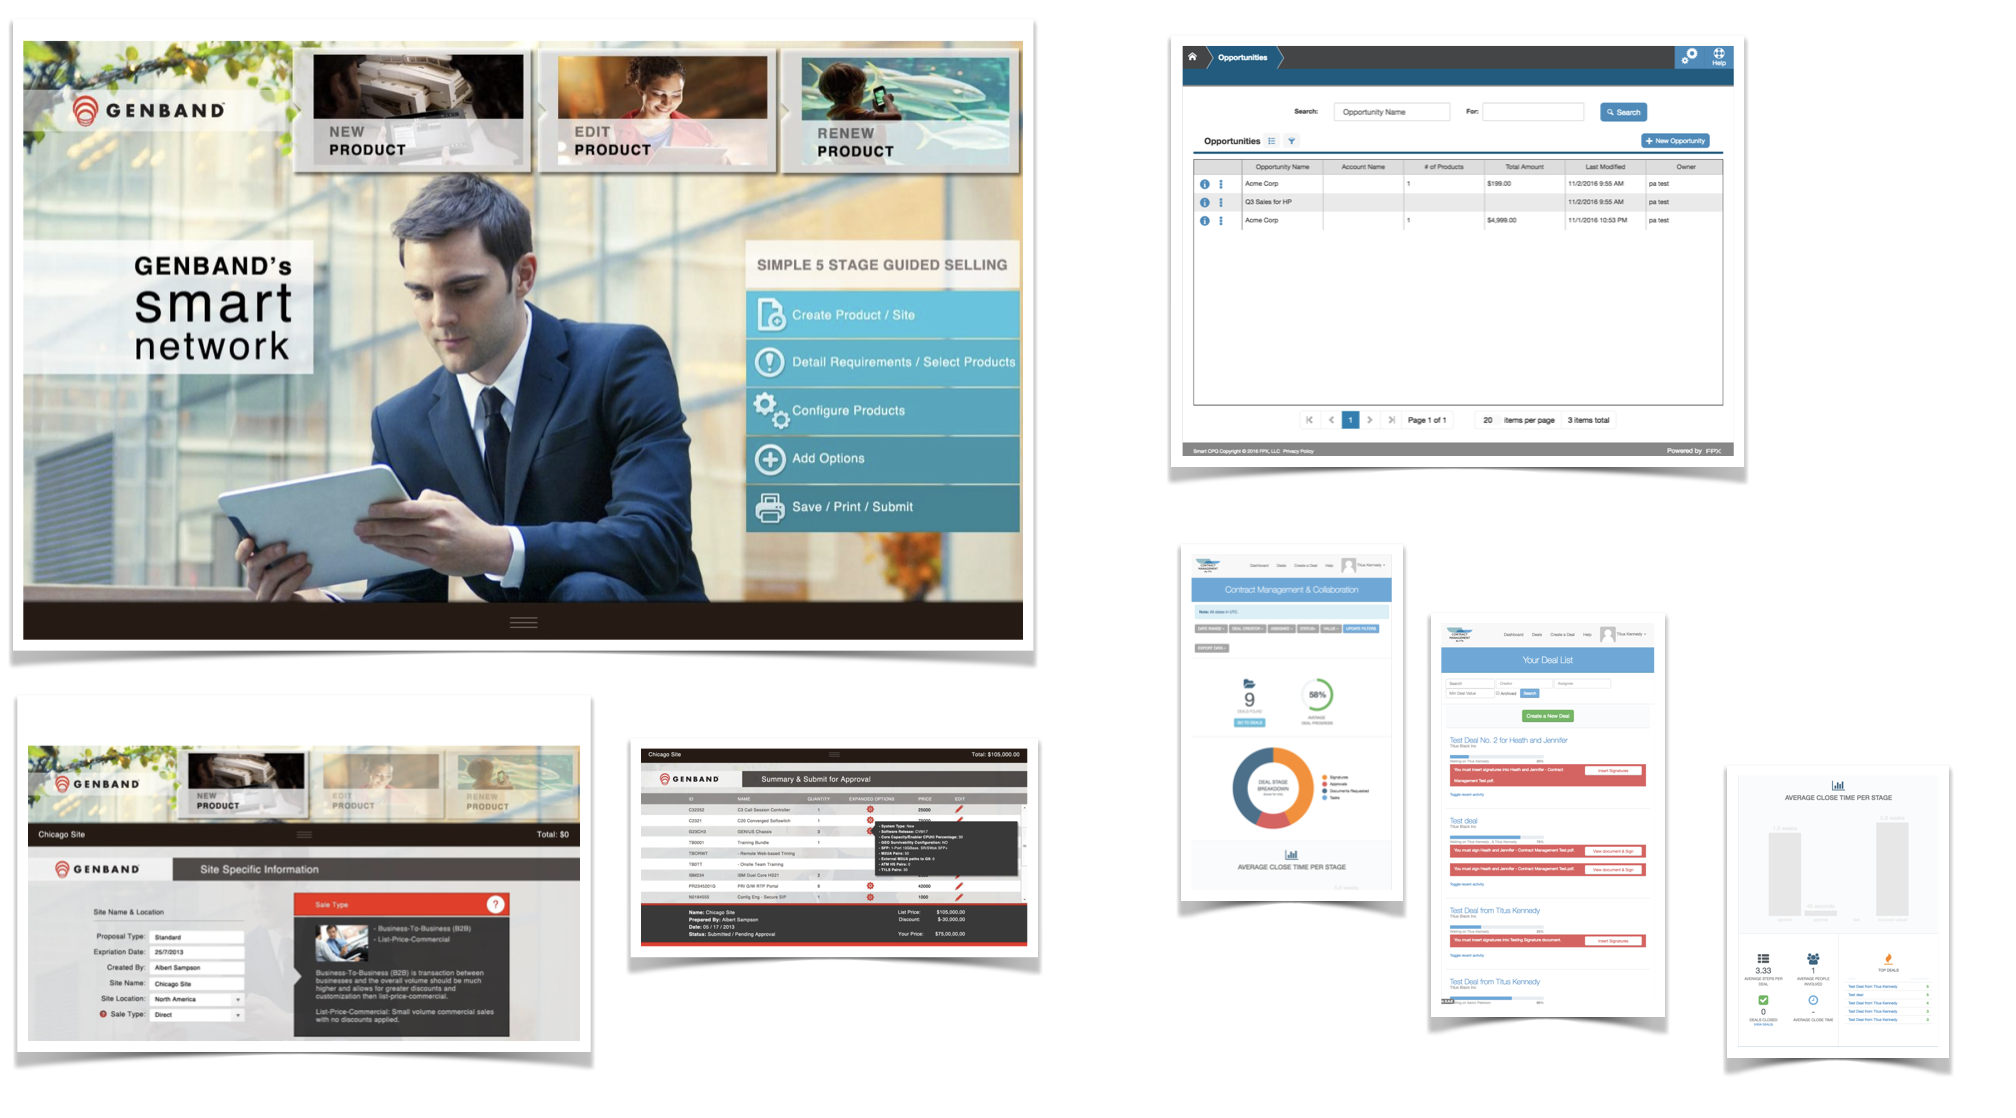
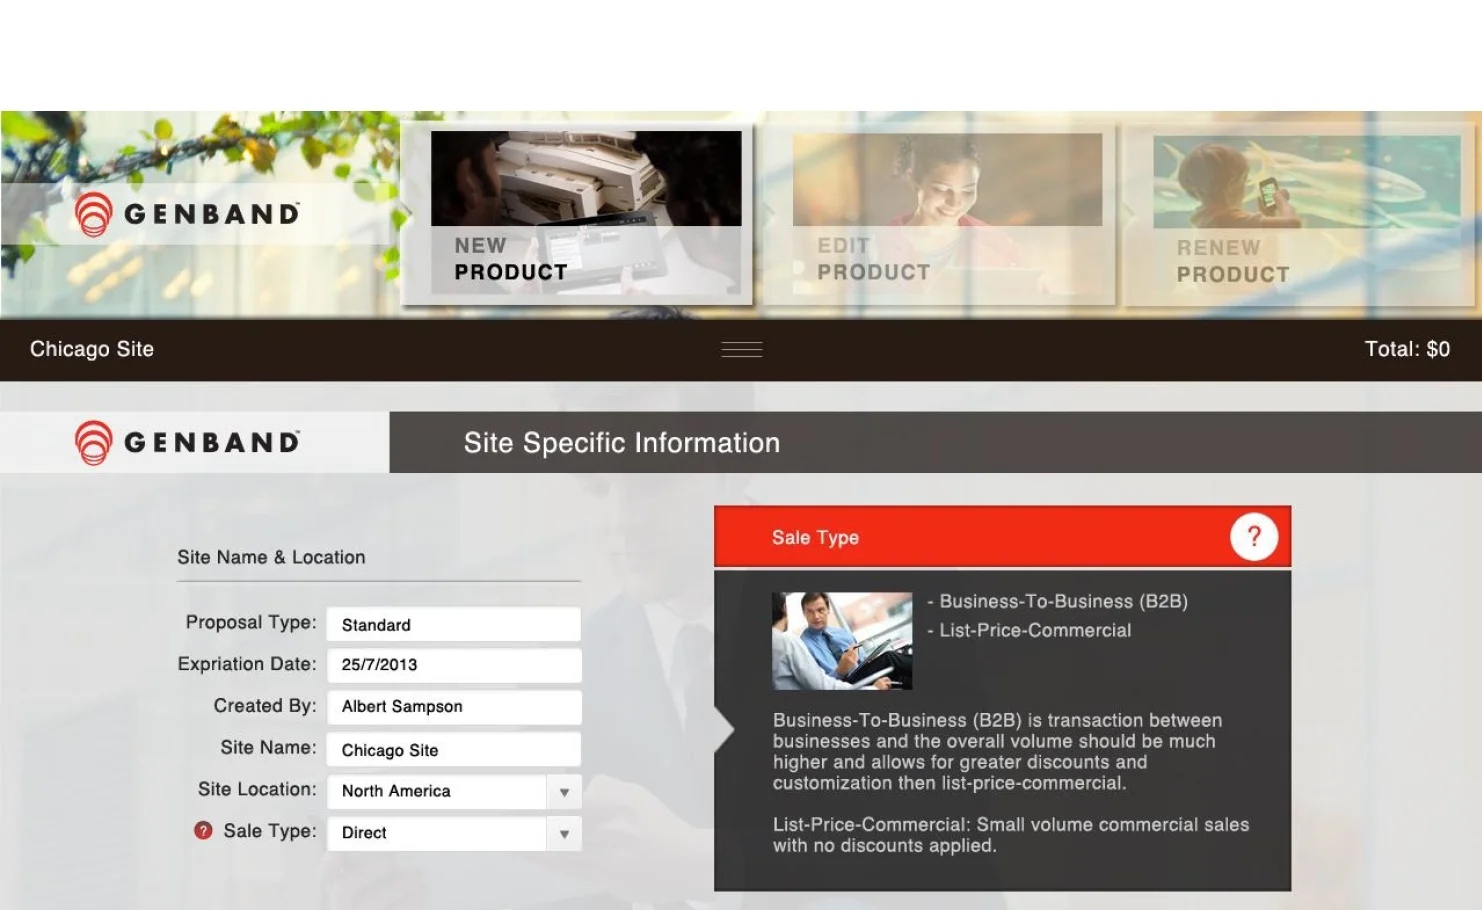
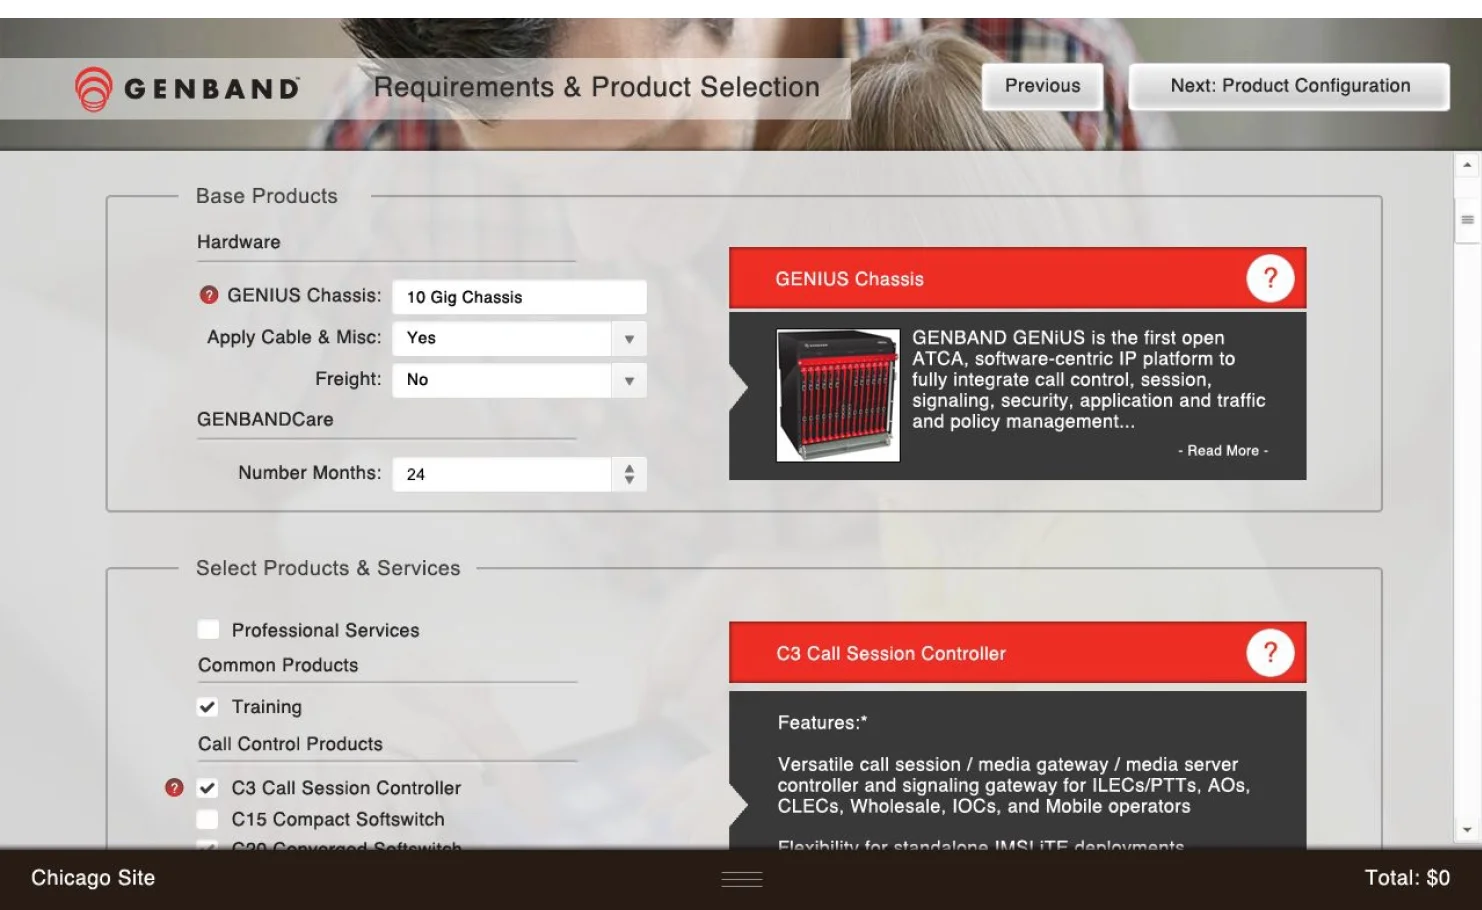
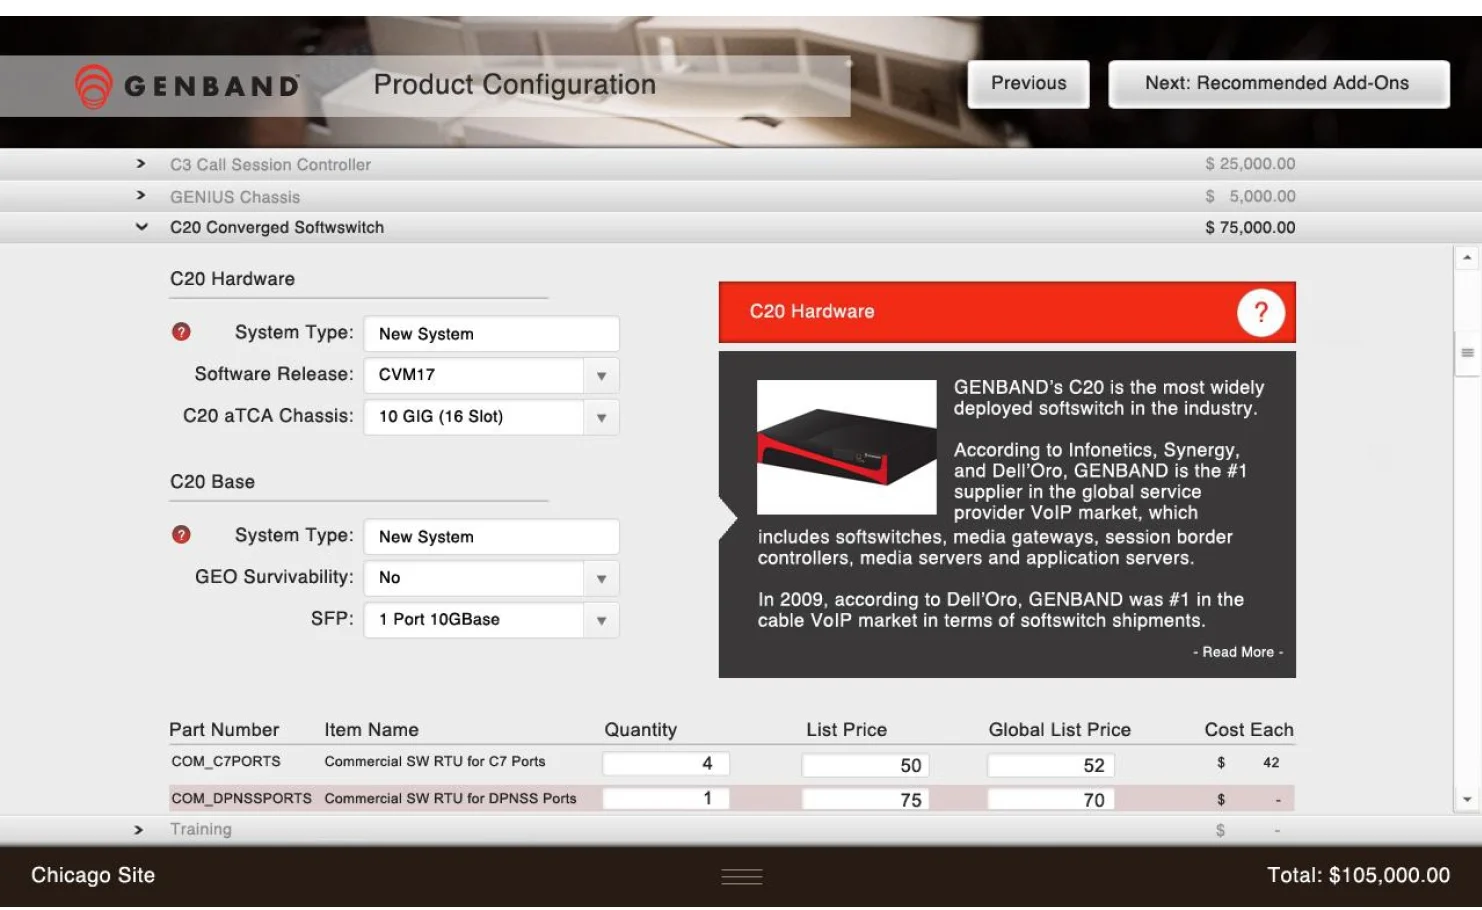
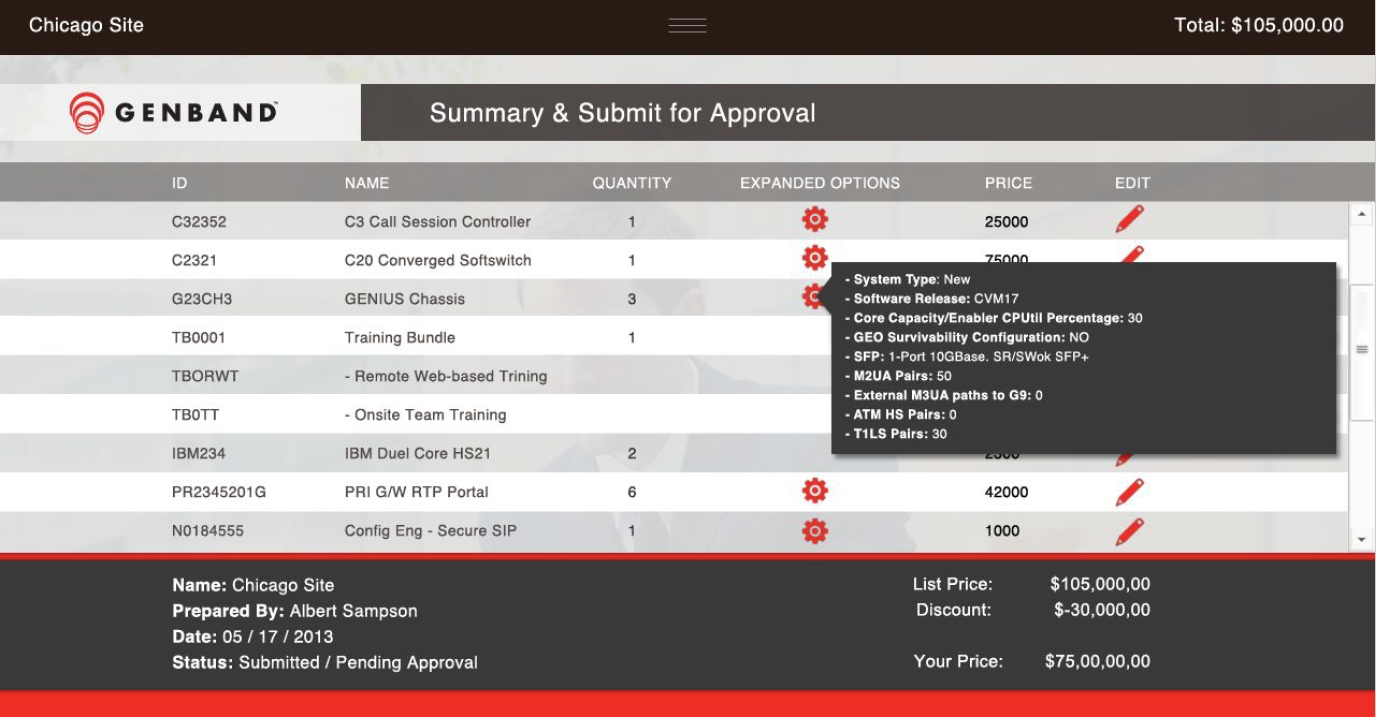
CPQ allows highly complex products to be quoted with ease, and turns a ninety day sales cycle into a matter of weeks. The complex products referred to are the likes of AirBus quoting sales cycle of airliners, Hitachi Data Systems server mainframe sales, Honeywell Building Solutions quoting of major commercial building projects such as US Bank Stadium, or Blue Cross of California attempting to increase their renewal revenue by streamlining the insurance purchase process – CPQ is the complex, business-rule driven quoting software that can handle all aspects of supply-chain management and crunch the data with predictive analytics to ensure a deliverable profitable quote. It uses data analytics to produce predictive analytics to guide selling of complex products.


Form Factor Sample Prototypes.png
 

2014  was a year of significant transition for FPX's database management business.


On June 5, thousands of global FPX subscribers received cloud-based access to the myriad of products within their catalogs.


To comply with my non-disclosure agreement, I have omitted and distorted confidential information in this case study. The information in this case study is my own and does not necessarily reflect the views of FPX.


lightbulb_diego-ph-249471 - Copy.jpg


My Role

I led the design team on the integration of several disparate systems and the creation of Interactive Rules App since the outset of the project in March 2014.

Up until March 2016, I guided our team efforts to evolve the service and address customer pain‐points related to the browse and data maintenance experience.


Capture.JPG


Customer Insights & Ideation 

I partnered with three project managers and led seven other designers to uncover insights and translate concepts into features that address customer behaviors and motivations.

Key tropes were gathered via contextual inquiry and subsequent follow-up communication. 


Experience Strategy & Vision

I created frameworks and prototypes to share the vision, design principles and content strategy. This helped to evangelize ideas, gain alignment, and drive decision making.


Planning & Scope Definition

I defined the product with my project manager partners. I evangelized customer goals and balanced business goals. I prioritized and negotiated features for launch and beyond.


Oversight & Coordination

I designed across and collaborated with seven platform designers and their PM partners to translate product features for each platform context. I hired two designers to boost our production. 


Design Execution & Validation

I designed down on Omnigraffle and Axure. I executed journeys, wireframes, prototypes and design specs. We tested our UX against our defined project goals.


Leadership

I designed up and presented works to gain buy‐in from executives, senior stakeholders and stakeholder teams throughout the project life-cycle.


The Challenge

Create Deeper Relationships with Customers

Since 2003, use of the Product Data Manager (legacy software) has declined and now a sizable proportion of the FPX clientele are made up of web-based business models. For key stakeholders, this signaled a rapid change in data access habits.

Our challenge was to evolve with customers and enter the highly competitive cloud-based database segment in the U.S.

Interactive Rules Application would offer a customer definitions, product data sets that talk with one another, all from anywhere with internet access With this new benefit we hoped to create deeper relationships with FPX customers.

 
companies.jpg


The Approach

Empathetic Design

In favor of speed to market, we were tasked to design and build Interactive Rules App within the existing constraints of Configure Query Language and Javascript architecture. This tactic was perceived to be the quickest and best way to put a new UI on the configuration engine.

The assumption was simple—thousands of sales people need to be able to access product and pricing data everyday. Extend the price, edit, manage conceptual model that customers were familiar with and leverage the existing infrastructure to get to our clients sooner and cheaper.

This early architectural decision had a major impact on the quality of the customer experience we could both create and reconcile.

 
fpx-ira-waterfall.jpg
 

Agilely Iterating

Feature design and development were broken into bi-weekly iteration workstreams (sprints) for the Cloud Edition and Enterprise Edition. I led the design for all aspects related to the applications.

Each feature phase of the project was serialized, starting with the design and development for the reference platform—Product Data Manager. Once each feature was designed and approved, the engineering team began the implementation.

I followed by working with platform designers to translate product features for their platform’s context. Concurrently, I would design the next feature in the pipeline, while also working with my own platform engineering teams to execute the current feature through to completion.


The combination of a fixed launch date and aggressive scope created an intense environment with many coordination and time challenges.


The Discovery

Contextual Inquiry

We conducted customer and super-user research to drive our planning phase.

These are the key insights that defined the launch version of the product:


Programs In Use At One Time

The users of Product Data Manager tend to depend on several programs at one time. Jumping from software to software caused mental friction for the user.

Drafting in Notepad

Taking notes happened frequently throughout users time spent using Product Data Manager. Allowing a draft-pad within the Interactive Rules Application would allow the users to remain in the app for all their CQL-syntax drafting needs. 

Quarterly Change Request

Customers change data throughout the whole quarter, however they do not allow changes to the database. The process seemed to be throttled and controlled by this bottleneck. 


Timed Out?    No, Thank You

Barring any security concern, users should be able to remain logged in for longer periods of time.

Prerequisites for Testing

Users feel the need to make several changes to product data before testing, instead of testing each product entry.


The Vision

Simplifying the Domain Complexity

Our vision for Interactive Rules App was to be the best pricing and product data service for FPX clients and customers, not a just a new skin on an old antiquated application.

We did not want to offer an exhaustive list of products in a catalog, rather wanted to focus on helping customers input pricing and data changes, from a user interface they will actually be able to use and understand.

Our customers expect and trust us to know them. We envisioned the taking the domain complexity out of the product data analyst's job.

work_domain.jpg

Together with FPX flagship quoting software, Smart CPQ, this robust offering would make enterprise businesses with complex business rules pique their interest in FPX's offerings.

Ease-of-use is what we wanted customers to exclaim praises about.


The Service

Introducing CPQ Interactive


CPQ Interactive is FPX's structured application for creating and maintaining product and pricing definitions and complex business rules. It updates instantly with no coding or customization.


genband1.jpg


Turbocharge Your Selling Experience

Customers can add any Products or modify existing products, all updating collectively to a unified cloud location.


genband2.jpg


genband3.jpg


Configure Products

The Interactive Rules Application establishes one source for creating and maintaining the ever-changing business attributes that affect how companies renew and retain customers, and offer new products to existing customers.


genband4.jpg


genband5.jpg


fpx_desktop.jpg


fpx_desktop-tablet.png


The Framework

How We Got There

The biggest challenge I faced throughout this project was balancing moving forward with designs, while also collaborating with the wider team. Since this project touched every part of our Saas business, I needed to coordinate and get buy‐in from many teams that were both co‐local and distributed across the globe. This proved difficult.

Managing feedback was even more challenging because it felt like a swinging pendulum of viewpoints.

The team spent a disproportional amount of time debating design decisions— when there wasn’t data that could easily be gathered to help drive a decision. The impact was agony, paralysis and a growing skepticism for instincts in the design process.


Managing feedback was even more challenging and felt like a swinging pendulum of viewpoints.


I observed this pattern early enough in the project and invested time into creating documentation to help alleviate the data crutch and better articulate and distribute design rationale. Doing this upfront was quite time consuming, but saved a lot of back‐and‐forth as the project progressed.

Design principles and the content prioritization framework helped to create visibility into my decision‐making process and galvanize the team to share in the vision. We worked from Hartson and Pyla's principles with designing a Work Activity Affinity Diagram. Of the five steps to this design principle, contextual inquiry, contextual analysis, need and requirements gathering, and modeling, this phase fell into the analysis portion.


Content First

My earliest design challenge was to propose how we would display content in our data base application for our enterprise customers

I hypothesized that the users of Product Data Manager would be much more content with an experience that revolved around what made their jobs simpler. Defining the users persona became an integral part of uncovering our users emotions and motivations

During the think‐aloud exercise I asked the subjects to partake in, I was surprised to hear participants clustered content based on what they felt was predictable, what made them curious to keep defining products and product rules. For the sake of brevity, we classified our users into Business Data Analysts generally. The key metrics for measuring success were based on this single user persona, much to my chagrin. We were still able to garner positive feedback though I felt like this was a limitation of the research aspect.

 
uxchart.jpg
 

Sketching Out The UI

A technique I used to brainstorm content ideas was inspired by a technique from Hurst and Terry's "Customers Included".

I imagined the worst possible outcome of the project was to put a new skin on a legacy (near-legacy) application.

From this exercise, it became clear that we could help customers derive more value from the service if we crafted a human-like feel to the users’ experience.

To gain buy‐in for this direction, I created a set of campaign composites, from which the user interface developers could build the application. Although many of these concepts were not feasible, they were still important to help get the team thinking about what was possible.


The Impact

A Good Start ...And We've Only Just Begun

 It’s still early days for the Interactive Rules Application, yet the results have exceeded our expectations. Since the launch of the redesign of Product Data Manager into the Interactive Rules App, the median number of active customers has increased by 246%.

Despite this rapid growth, we improved on key engagement, retention, adoption and acquisition metrics.


Increased median active days per customer by 23%


Increased median amount of users by 45%


Increased new customer retention rate by 78%


I just love the new interface. It knows how I want to do my job!
 
Since FPX implemented the new Interactive Rules App, I can be much more efficient, and it’s not such a drag to use anymore!
 
I can literally make product changes that hit my database in two minutes or less.

Reflections

What I Learned

Customers Have The Key

Speed to market is not winsome enough.

One of FPX's conventions of decision making revolves around timing. Customers can handle the wait (if the timing expectation is set) way more easily than they can handle a haphazardly constructed application.

Throughout this project, I observed how bias‐for‐action mutated into a bias‐for‐delivery. Our team disproportionately focused on measuring outputs, rather than learning and measuring outcomes. This inevitably led to a lot of waste, nearsightedness and distraction for the team.

We let the question “how quickly can we build it?” define the it, more than we let our customers define it. We let the phrase “let's just get something out there” define quality, more than we let our customer define quality.

If we had asked “are we building the right thing?” as much as we asked “are we going be able to deliver to our customers at this particular time?“, we would have launched a more reliable, intuitive and polished product, much more quickly.

Viability should have been defined by our customers way before the technology and date already did.


Including Customers, To A Degree

I value simplicity, focus and utility. I aspire to make people happy by designing experiences that just get out of the way. Craftsmanship and carefully thought out details are important to me. I truly value music and care about helping people find music to complement the meaningful moments in their lives.

Today, thousands of customers are utilizing Interactive Rules App and we are exceeding our business objectives. And while I can't prove how much a little more research effort would have benefited our business, at least the product is not considered completely finished.

Henry Ford's famous saying is that if we would have asked what the customers wanted, they would have said faster horses.There is a delicate mix between doing exactly what your customers want, and knowing what they want, unbeknownst to them.


CPQ Interactive

Role: UX Manager

Coverage & Awards: Tekne Awards 2016

Methods: Design Thinking, Contextual Inquiry, Data-driven Design, and Design Product Roadmapping.

Artifacts: Clickable Wireframes, Strategic Research Report, Competitive Analysis, Stakeholder Presentations, and Client Meeting Presentations.

Created at FPX.